
Organizations are good at making plans and much worse at executing them. The analysis, the sessions and the documents get the attention. Month four gets far less.
Ticking off every action in a plan that turned out to be wrong is not success. So this part of the product has two jobs: make the rhythm cheap enough that teams keep it, and make the results legible enough that the team learns something from them.
The rhythm, in one picture
Two sessions carry the whole thing. Monthly, the action review asks whether you are doing things right: progress on actions, what is stuck, who needs help. Quarterly, the strategy review asks the harder question of whether you are doing the right things, and it looks at the KPI trends behind each strategy to answer it.
Two action reviews, then a strategy review. Four times a year.
The rest of this page shows how the product keeps that cadence cheap.
Reporting takes minutes, not an afternoon
One habit decides whether a review is any good: owners report before the session, not during it.
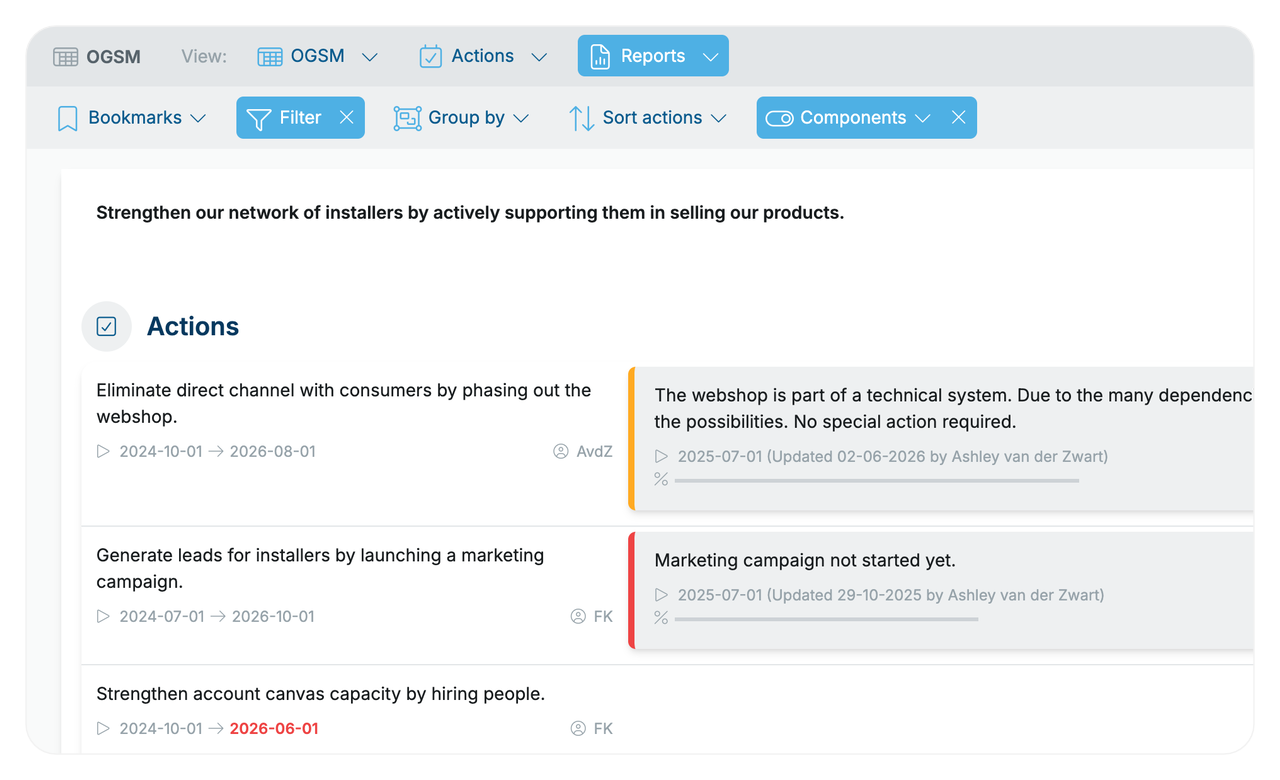
That only happens if reporting is quick. A progress report is three things:
- Progress. What percentage of the work is done
- Assessment. Your own judgement: green, amber or red
- Explanation. Why that colour, what you did, what comes next, and what you need from the team
That last line is the one people skip and the one that makes the meeting worth attending. “Amber, blocked on legal, I need someone to escalate” turns a status update into a decision the session can take.
Owners report on strategies, KPIs and actions: all three, in every plan. Measurements on goals and KPIs can also be imported from external systems, so numbers you already track somewhere do not get retyped.
Traffic lights that people actually use
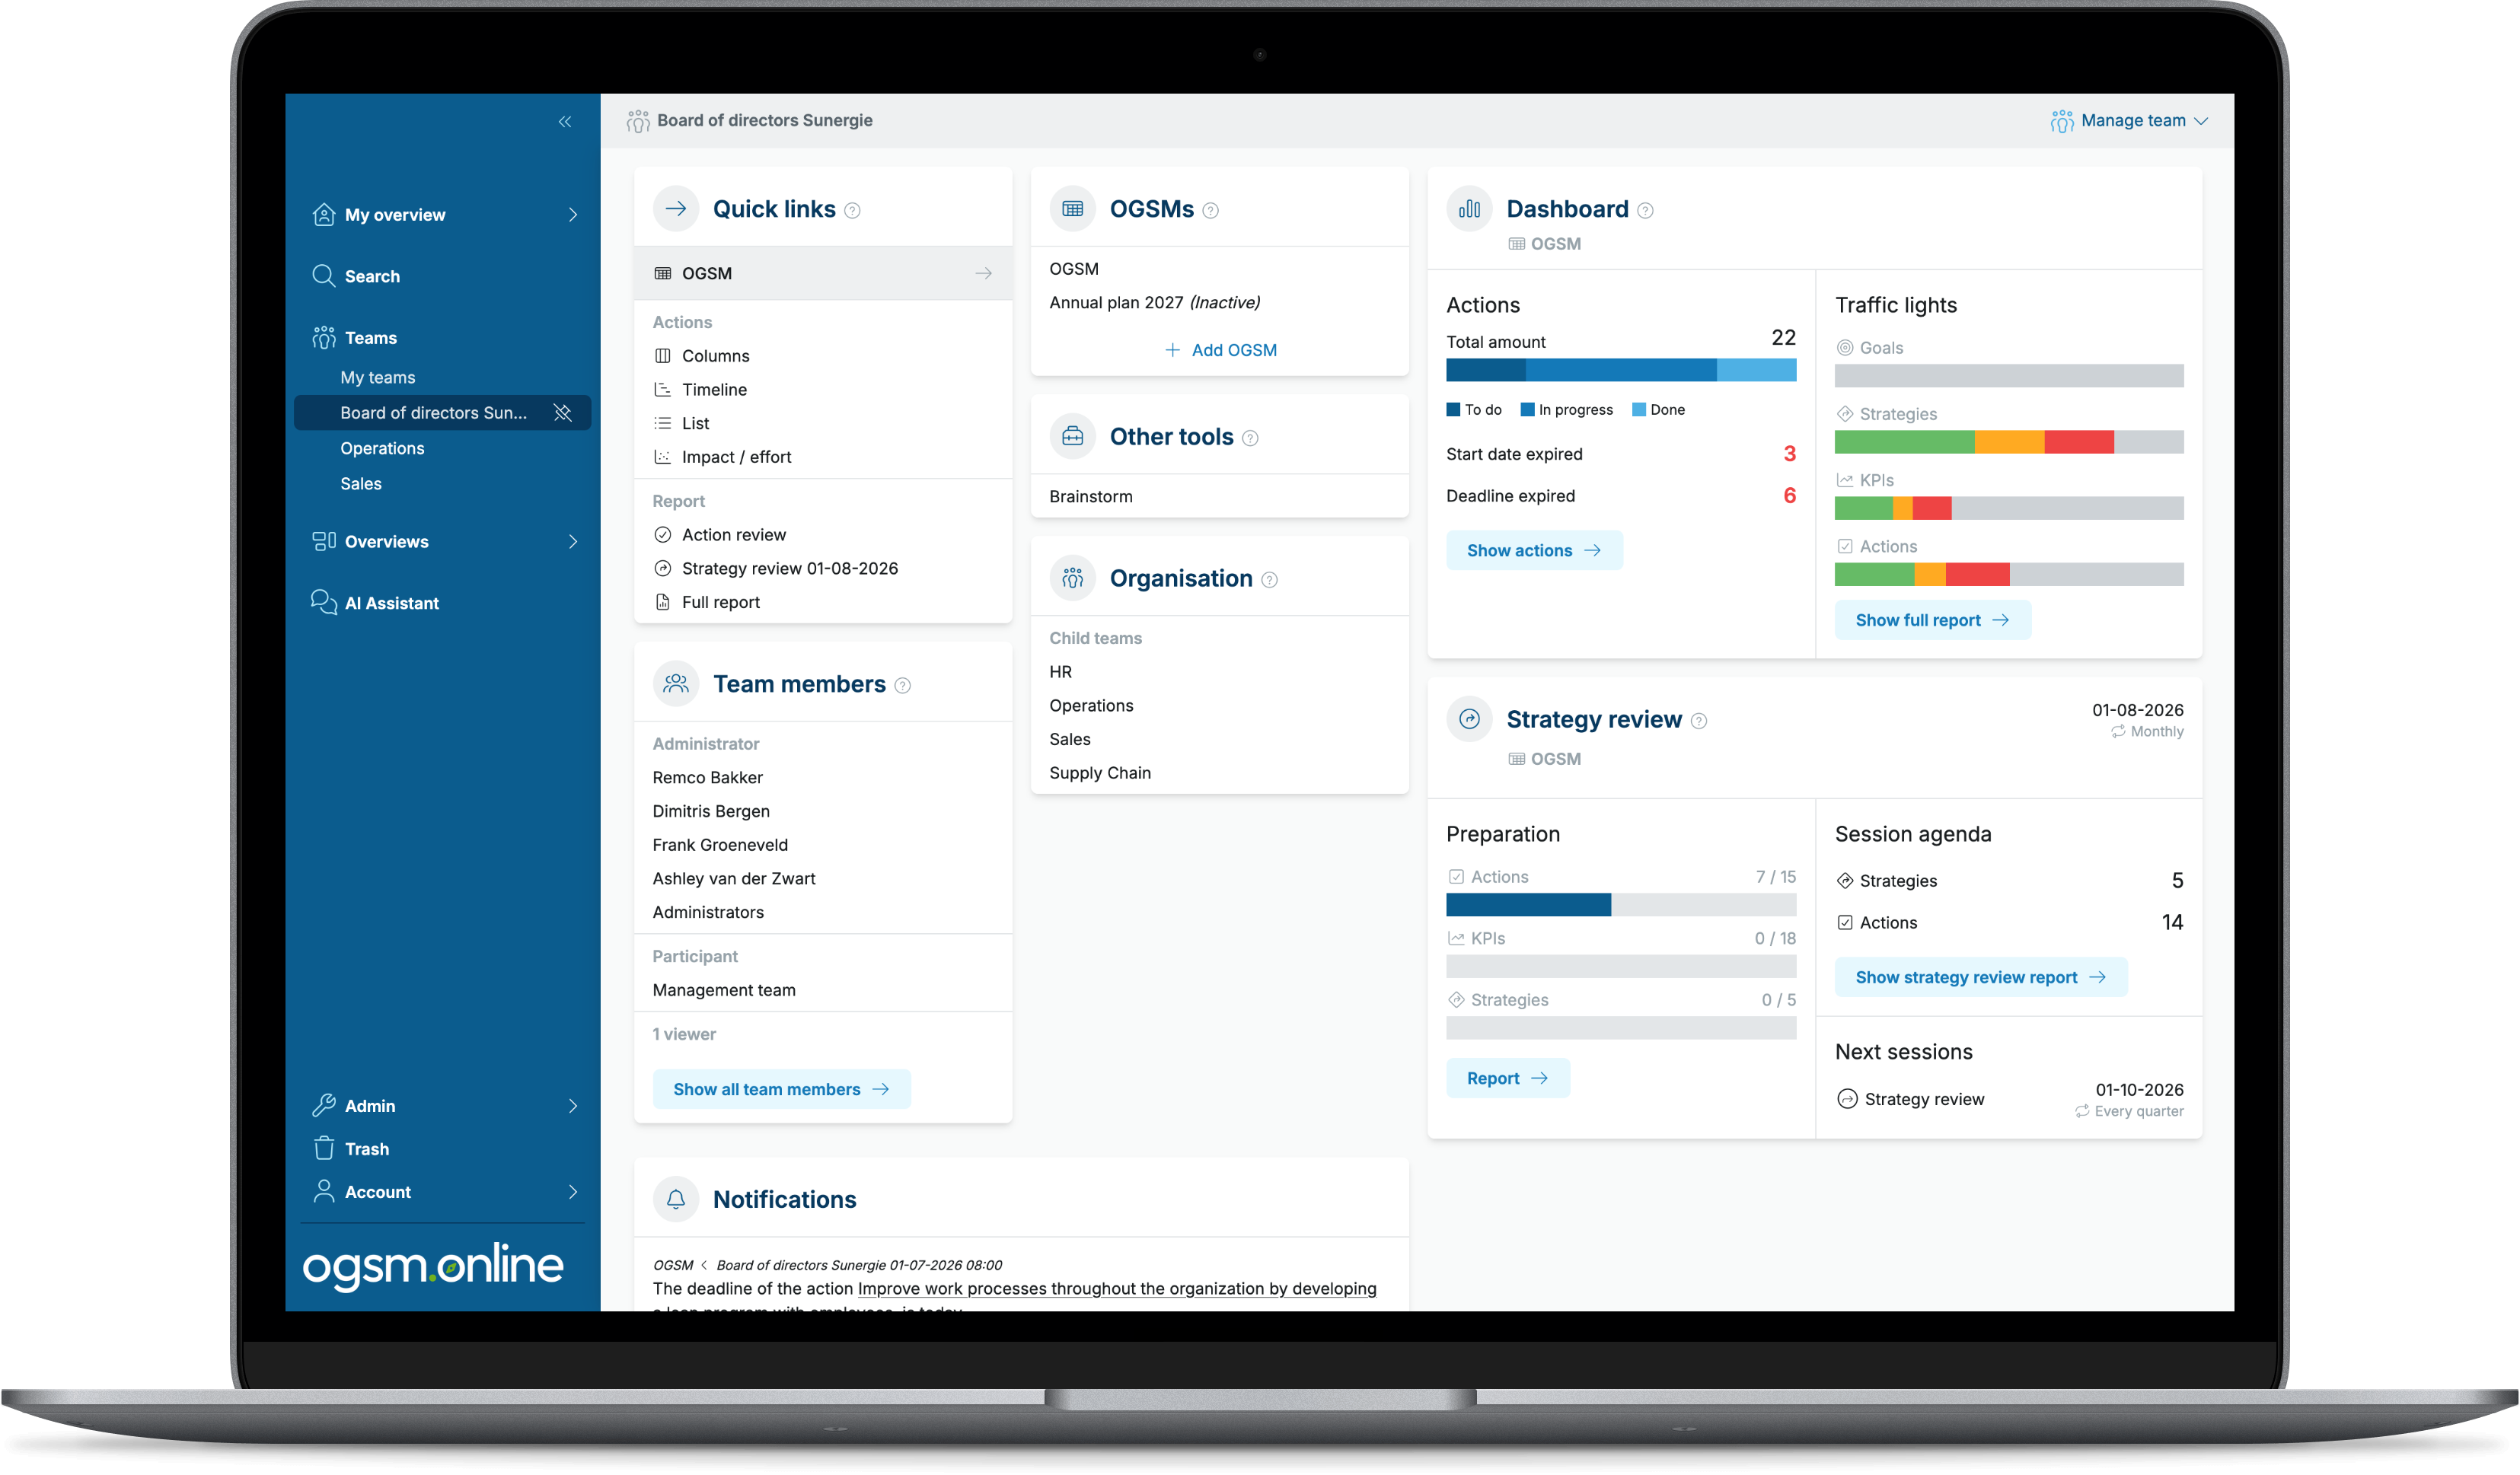
Green, amber, red. The colours are simple; making them honest is the hard part.
Amber has to be safe to report. If it is treated as failure, everything stays green until the month it turns red, and the dashboard stops telling you anything you could have acted on. That is a culture question more than a software one, but it helps that reporting amber here is a request for help attached to a specific explanation, not a confession filed in public.
Status rolls up. Actions into strategies, KPIs into strategies, strategies and goals into the plan as a whole. So a team dashboard answers the question “where should we be looking?” before anyone opens a single report.
Learning from the numbers, not just recording them
Traffic lights tell you how someone feels about their item this month. The measurements tell you whether the strategy is working, and that is a different question.
Every measurement is kept. When you enter this month’s figure, last month’s does not disappear. So a KPI is a line rather than a value: where it was, where it is, and how that compares with where it should have been by now. That is the difference between “we are at 48” and “we are at 48, we planned 75, and the gap has been widening for two quarters.”
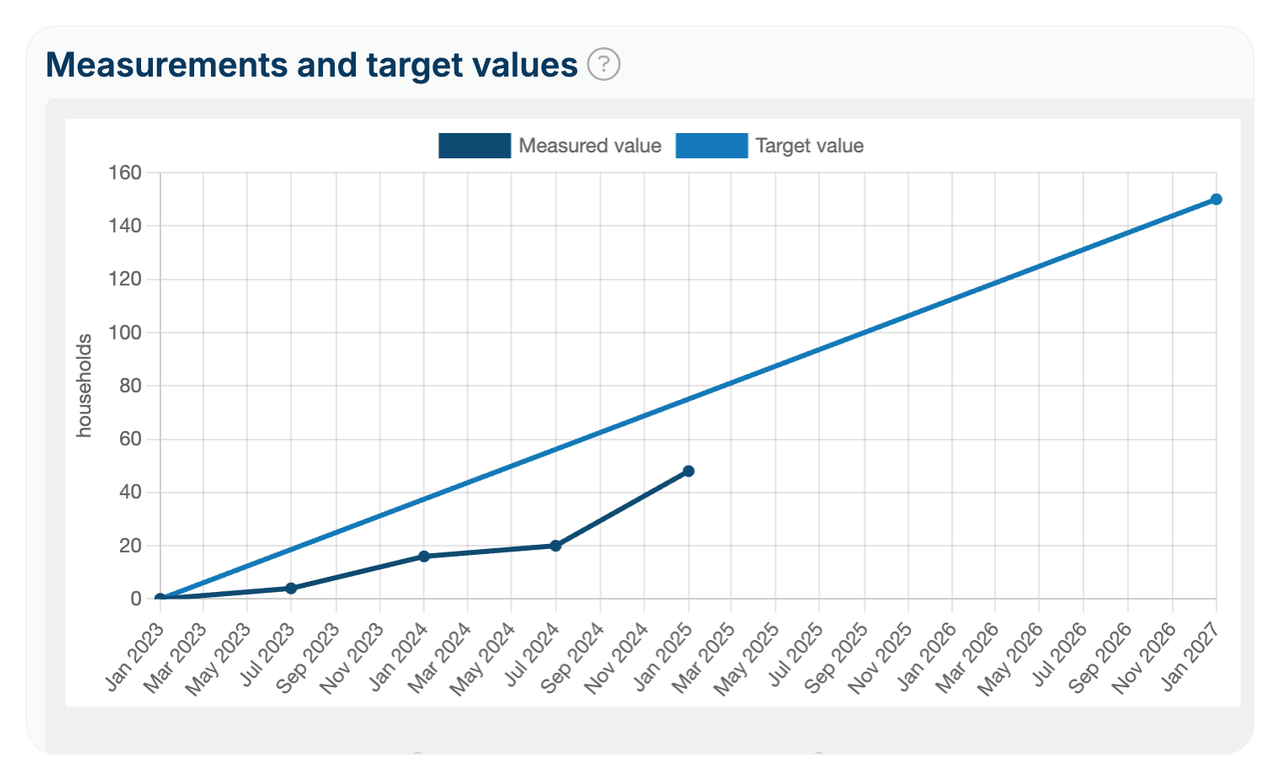
Which is what makes the quarterly strategy review possible at all. That session asks whether the route still makes sense, and it can only be answered from trends. Sometimes a strategy that seemed right in January no longer is. A quarterly cadence means you find out within three months.
Two habits make this work in practice. Mix result KPIs with effort KPIs, so something moves before the outcome does: calls made tells you the strategy is being executed long before revenue growth tells you it worked. And write down why you changed your mind when you adjust a strategy, because next year somebody will ask, and “we decided the acquisition route was too slow” is worth more than a plan with no history.
One set of actions, four views
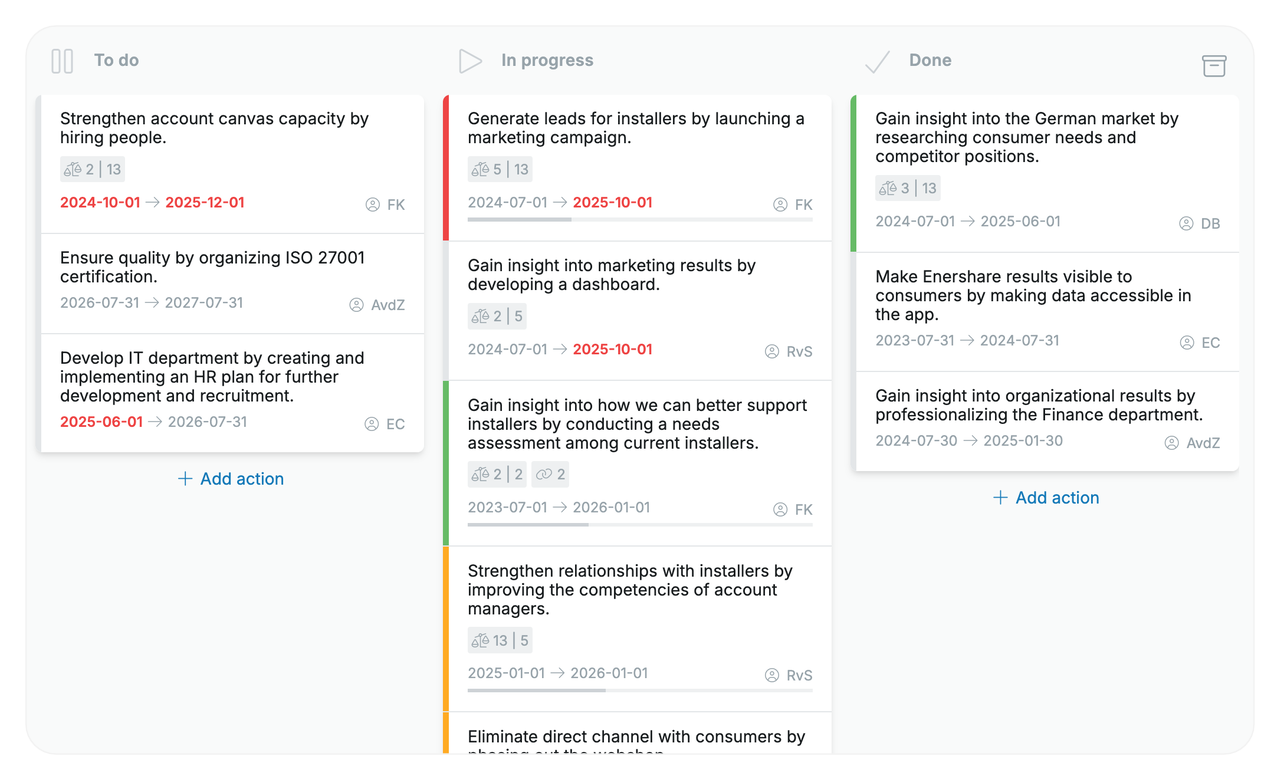
The same set of actions looks different depending on the question you are asking. So there are four views of the actions:
- Kanban board. What is in progress and what is stuck. Columns are configurable.
- Timeline. What lands when, and what is quietly stacked in the same month
- List. Filter, sort and bulk-edit
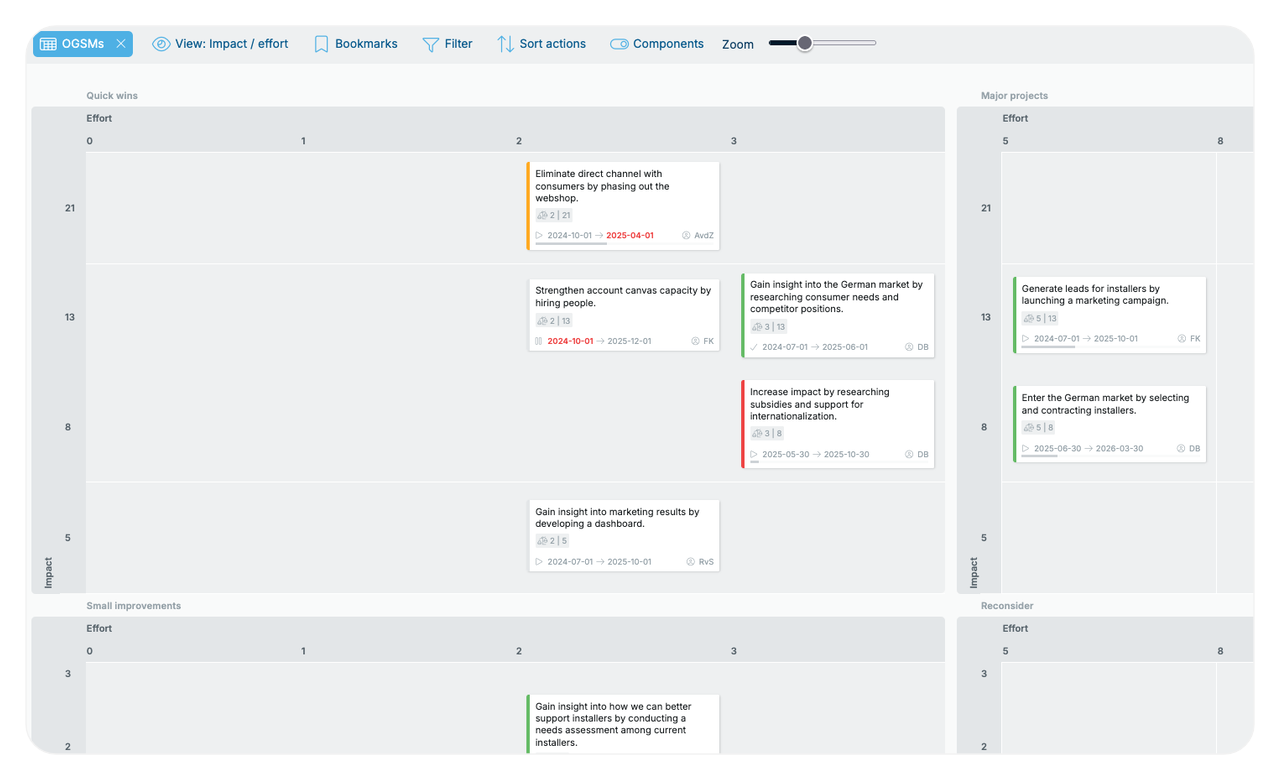
- Value and effort matrix. Which actions are worth their cost, and which are big for what they return
That last one earns its place during prioritisation. The first version of an action list is almost never feasible, and plotting value against effort is the fastest way to find what to cut.
Everyone sees their own slice
Most people in an organization do not need the whole plan. They need their part of it.
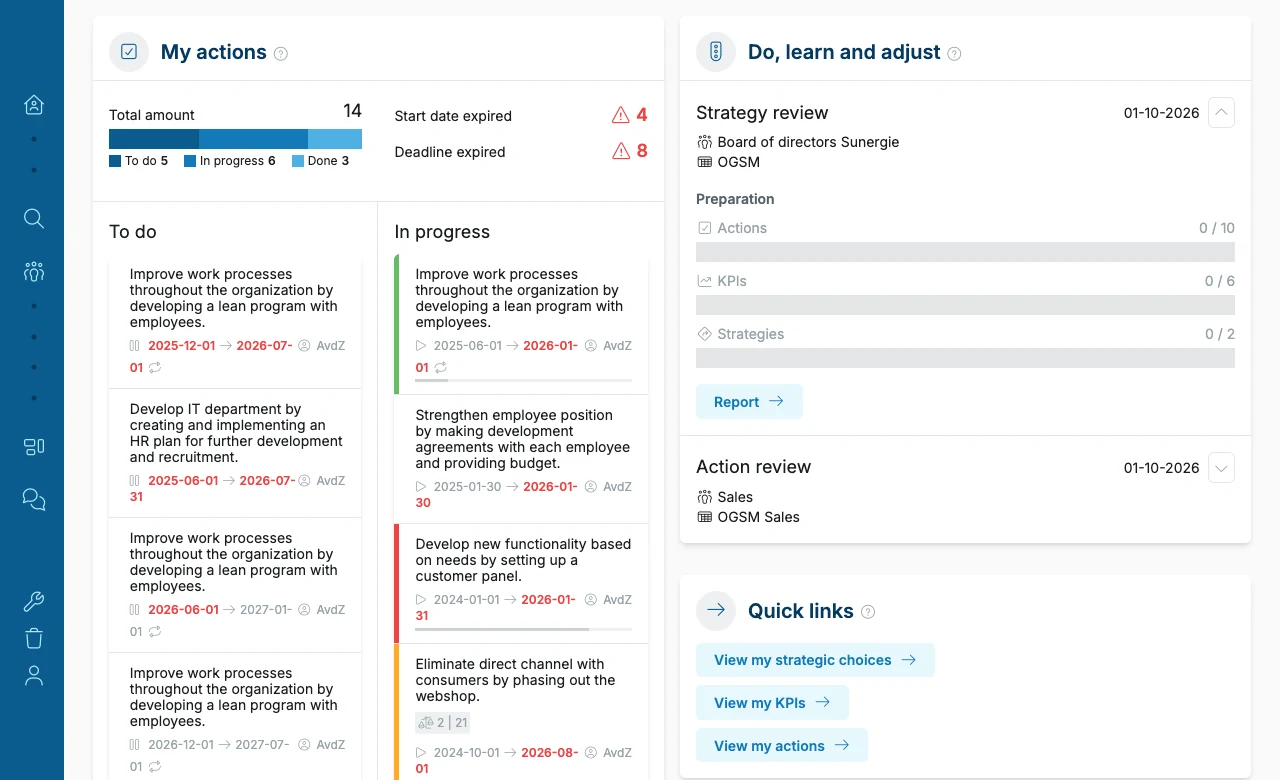
The personal overview shows your teams and their OGSMs, your actions, your updates, and the reviews coming up. It is the screen that turns “the strategy” into “the three things I owe someone this month.”
Sessions that run themselves (Pro)
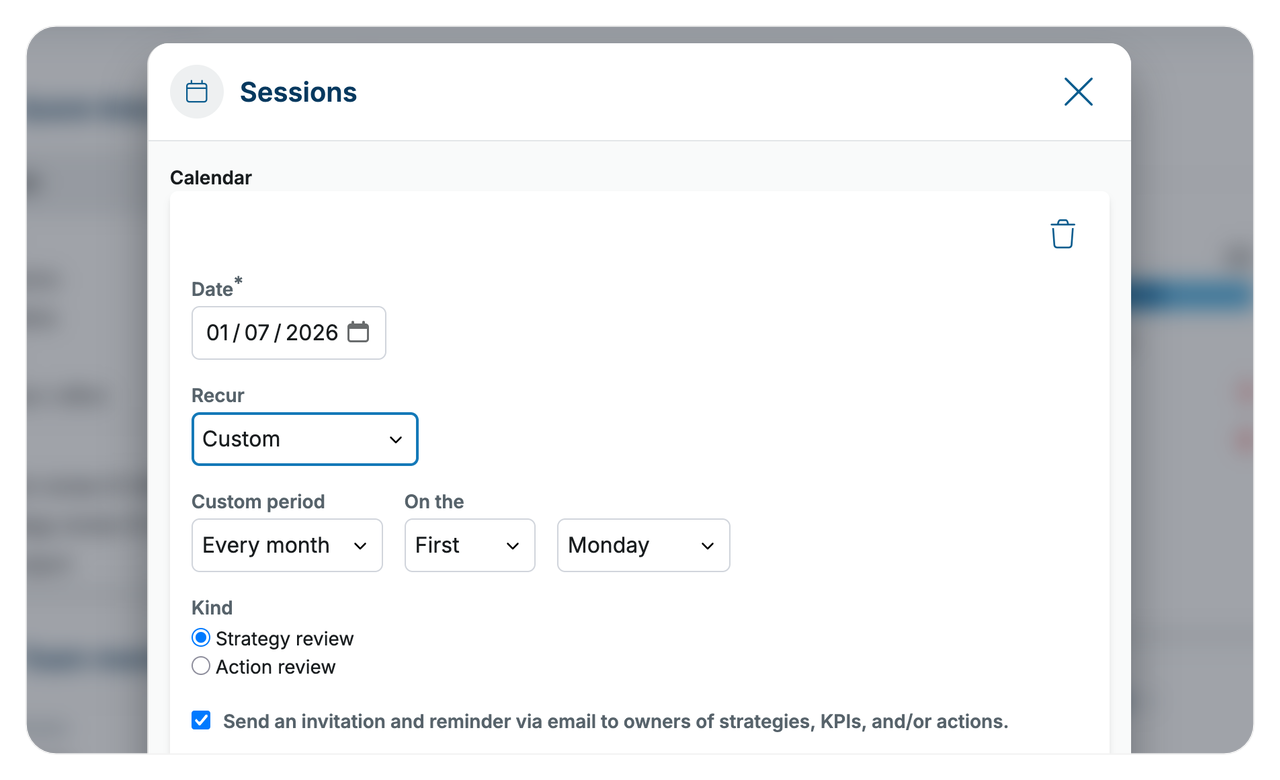
On the Pro plan the rhythm gets scheduled rather than remembered.
Session planning sets up the agenda for action reviews and strategy reviews. Automatic invitations ask owners to file their reports in time, with wording you can change to match how your organization talks. And the reporting status dashboard shows the person running the cycle who has reported and who has not: before the session, while there is still time to chase.
That last one is what a process owner otherwise does by hand, in a spreadsheet, on the day.
Getting it out again
Plans have to leave the tool sometimes: for a board pack, a shareholder, an audit.
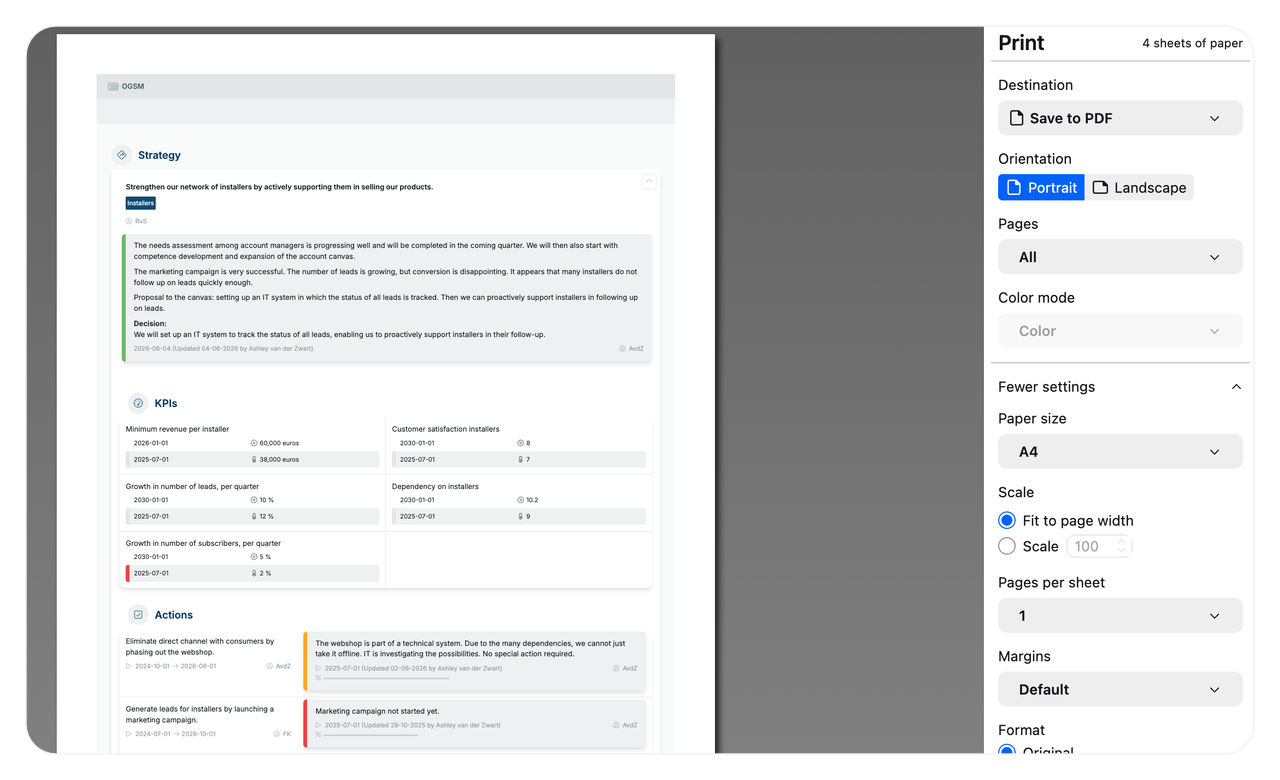
Export the full OGSM or any report to Excel or PDF. The print layout is designed to stay a one-pager, which is the whole point of the model and surprisingly easy to lose in translation.
Thirty days, no credit card, and the trial stops on its own.
Start your free trialThe method behind the screen
The two sessions and the two questions they answer are not our invention. They are the working method the book describes, and the reason the product is shaped this way.
The rhythm: action review and strategy review →
When several teams are executing at once, keeping their plans coherent becomes its own problem. How connecting works →